




How To Measure An Innovation Economy: South Korea
At Mind the Bridge, we are regularly asked to put numbers on something that is, by nature, hard to pin down: the health of an innovation ecosystem. Governments, corporates and investors all want the same thing: A benchmark that tells them how their country or region stacks up against the rest of the world.

The problem is that no two ecosystems look alike, and any methodology rigid enough to allow cross-country comparison risks flattening exactly the traits that make a place distinctive.
This is the tension we have been working on for years, refining a model that is standard enough to compare Boston with São Paulo, Tel Aviv with Turin, yet flexible enough to capture what is genuinely different about each. This week in Seoul, we presented the latest application of that work: The Innovation Economy of South Korea. It’s a good occasion to lay out, briefly, how we think the exercise should be done.
Start from the Pyramid
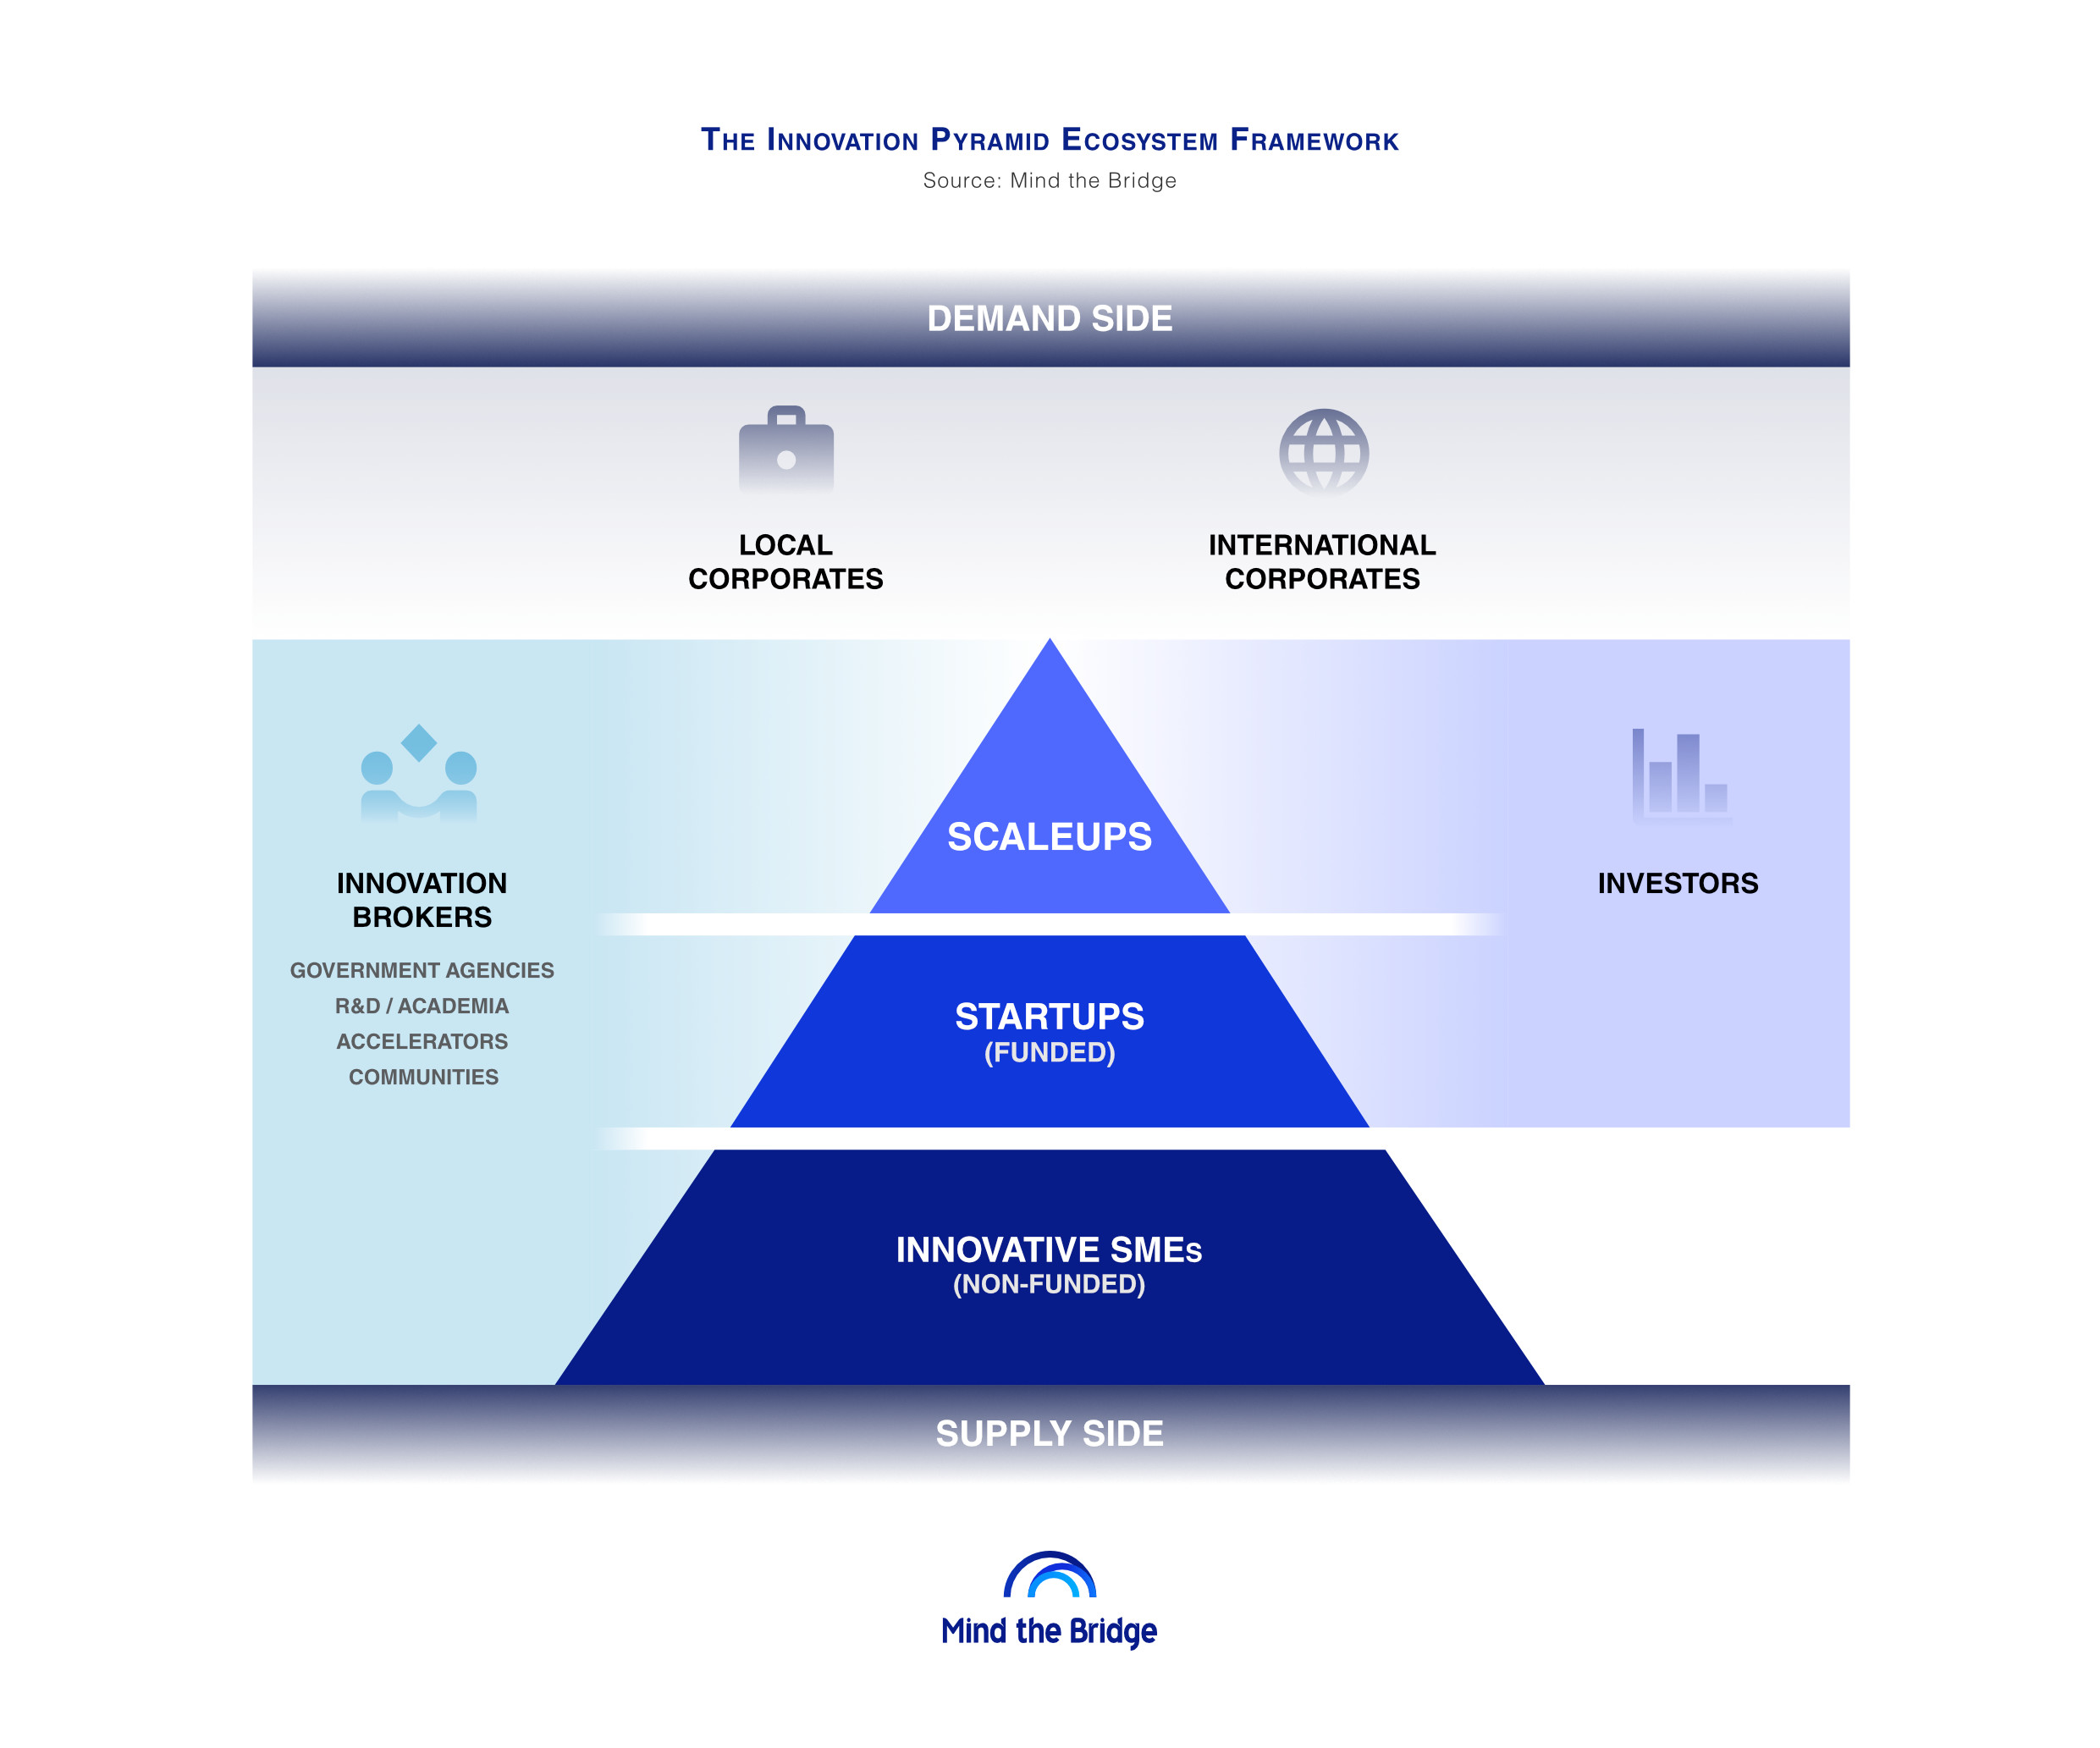 Every innovation ecosystem can be represented as a pyramid. At the base sit startups: venture-backed technology companies still in the process of building and proving their business.
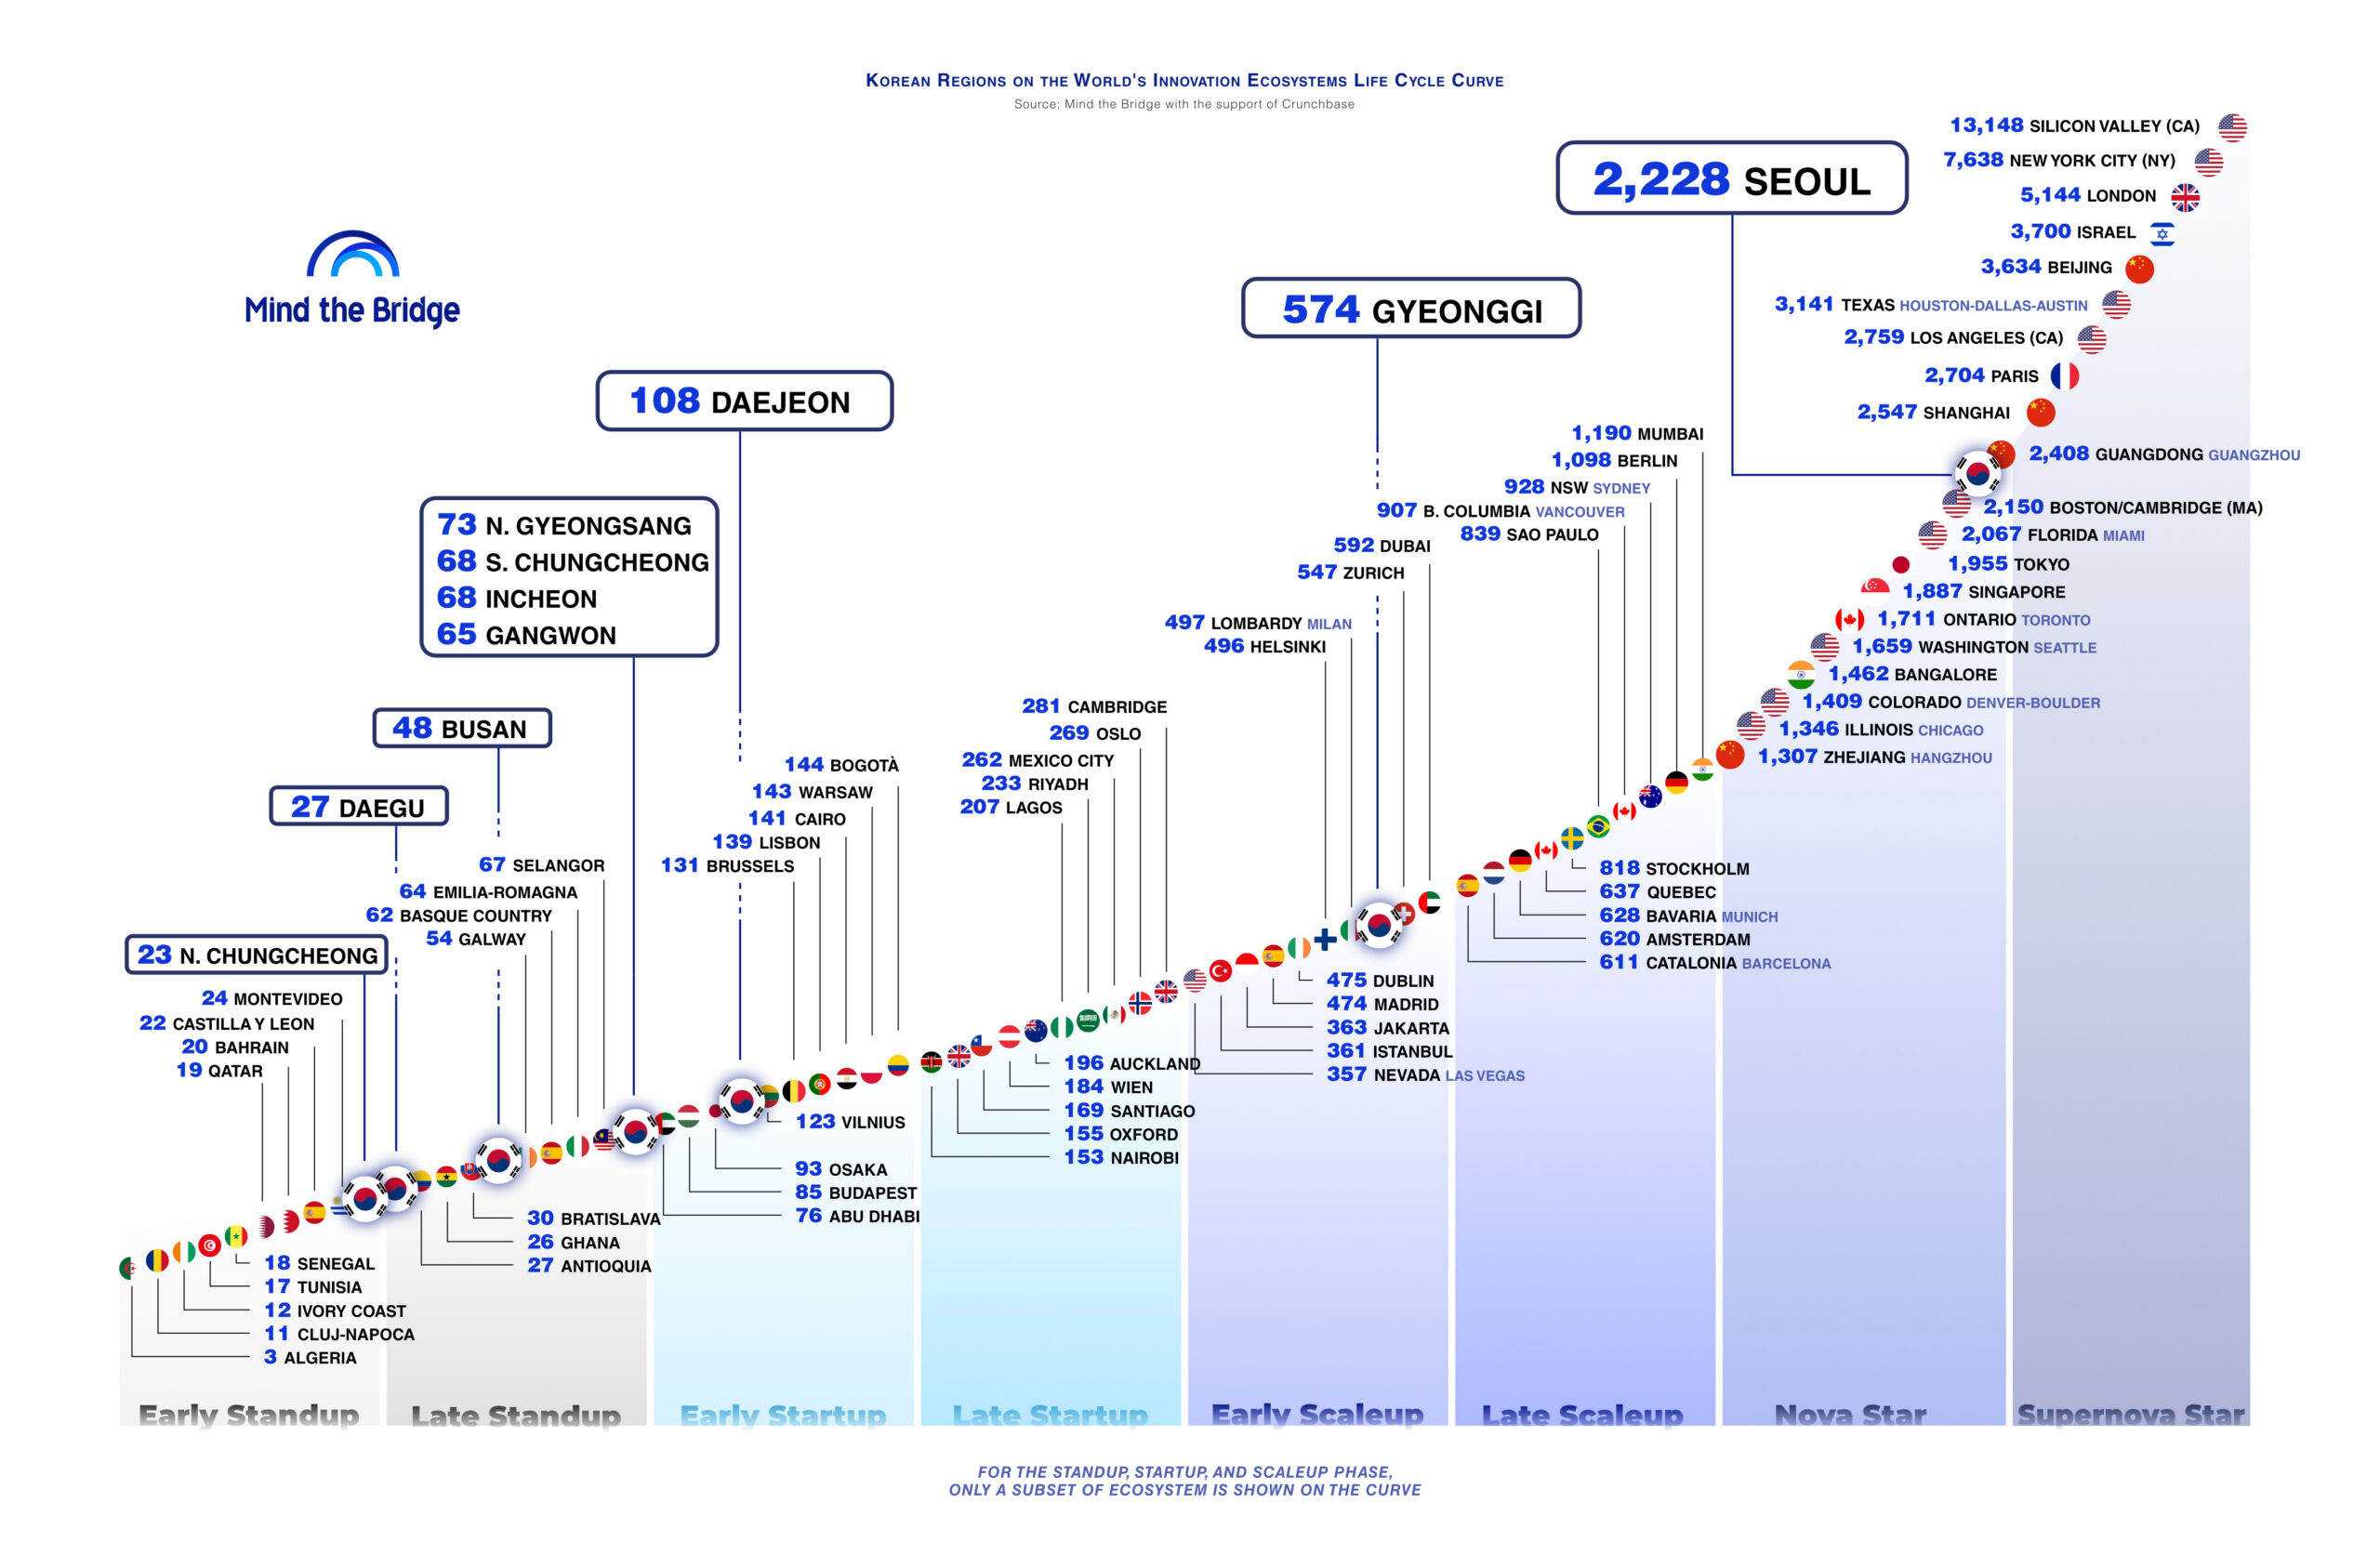
Move up and the base narrows into scaleups, or companies that have shown enough traction to raise more than $1 million in venture capital. Scaleups are the most structured, most visible output of an ecosystem, and for that reason they are among the best proxies for its maturity: You can plot their number, growth rate and sector mix against the Innovation Ecosystems Life Cycle Curve and get a reasonably honest read of where an ecosystem stands.
 At the very top of the pyramid are the outliers that matter disproportionately: scalers and super-scalers, companies that have broken out of their home market and achieved real international scale. A handful of these can do more for a country’s innovation profile than thousands of early-stage startups — which is why counting them separately, rather than burying them in an aggregate “startup” number, is essential to any serious methodology.
Alongside this VC-backed pyramid runs a second, often under-measured population: innovative SMEs, or established, revenue-generating small and mid-sized companies that compete on technology and innovation rather than venture funding.
Ignore them and you miss a large part of the real economy’s innovation capacity, particularly in ecosystems — Korea among them — where corporate-led and government-backed innovation has historically mattered as much as the VC route. Many emerge as bootstrapped companies. Some remain independent, while others may eventually raise external funding and move upward into the startup and scaleup layers.
All these tech companies stem from the knowledge base generated by local universities and research centers. Together, these layers represent the technology supply of an ecosystem.
Why the supply side alone isn’t enough
Counting tech companies gives you the supply side of the equation. But supply only turns into economic impact when it meets demand, and demand is largely, though not exclusively, represented by corporates, both local and international.
Corporates benefit from the solutions developed by startups, scaleups and innovative tech companies, while also potentially supporting their industrialization and growth through acceleration programs, venture client models, CVC and M&A. This interaction between technology supply and corporate demand is what turns innovation into economic impact and company growth — which is why measuring it, not just the supply side, is essential.
The supply side also interacts with local, regional and global B2C markets: Consumer demand is the other half of the demand equation, particularly for companies whose growth path runs through the market rather than through a corporate relationship.
The evolution of an ecosystem is everywhere, fueled by capital and public support. Private capital comes from angels, VCs and CVCs, providing companies with the resources to develop, commercialize and scale. Public support comes through subsidies, grants and government programs, delivered either directly or indirectly through innovation agencies, ecosystem builders and other innovation brokers.
The stronger the connection between these different sources of capital and the companies sitting in the pyramid, the faster companies can move from one layer to the next. The less advanced an ecosystem is, the more public capital needs to be fueled into the ecosystem to bridge the gap.
When an ecosystem reaches critical mass
As a local ecosystem reaches a certain threshold in volume, density and quality of companies — typically the Star stage of the Innovation Ecosystems Life Cycle Curve — it starts attracting increasing interest from external players. Investors, multinational corporations and government agencies begin establishing a local presence, because proximity provides better access to talent, technology, deal flow, partnerships and market opportunities.
One concrete way to measure this external attractiveness is by counting corporate innovation outposts set up by multinationals, alongside government innovation outposts set up by foreign countries, regions or cities. It’s an indicator that tends to lag the ecosystem’s real progress by a couple of years, which makes it a useful confirmation metric rather than an early signal, but a valuable one nonetheless.
The Korean innovation pyramid
 As for our latest count, 3,359 scaleups sit at the top of the South Korean innovation pyramid.
This makes South Korea the eighth-largest national innovation ecosystem in the world, with Seoul ranking as the 11th most developed ecosystem globally.
Below the scaleup layer sits a much larger base of approximately 10,000 startups, alongside an even broader base of approximately 25,000 technology companies (innovative SMEs) that are not venture-capital backed.
The enabling ecosystem includes approximately 700 investors and more than 550 innovation brokers, both public and private, powering more than 800 unique programs in support of entrepreneurship and innovation.
Beyond the number of scaleups, which is calculated analytically, all other figures represent our best-effort assessment of the different components of the ecosystem. The analysis starts from government data and consolidates available data sources. While this work is continuously refined, we believe that open-sourcing this data through the MTB Innovation Ecosystem Platform provides a further opportunity to build (innovation) bridges.
The demand side completes the picture:
- About 130 local companies with structured open innovation activities.
- Roughly 90 international companies with an identified innovation outpost in South Korea.
These figures are also subject to continuous monitoring and refinement as the ecosystem evolves and new players and activities emerge.
The point of measuring
None of this is an academic exercise. The output of this kind of methodology — as we discussed applying it to Korea this week — is meant to be actionable: It should tell a government where its ecosystem sits on the Innovation Ecosystems Life Cycle Curve, where the bottlenecks are, and how it compares to peer economies pursuing the same transition from startup nation to scaleup nation.
Get the methodology right, and the numbers stop being a scoreboard and start being a diagnosis.
A decade of divergence
This is exactly what happened in South Korea.
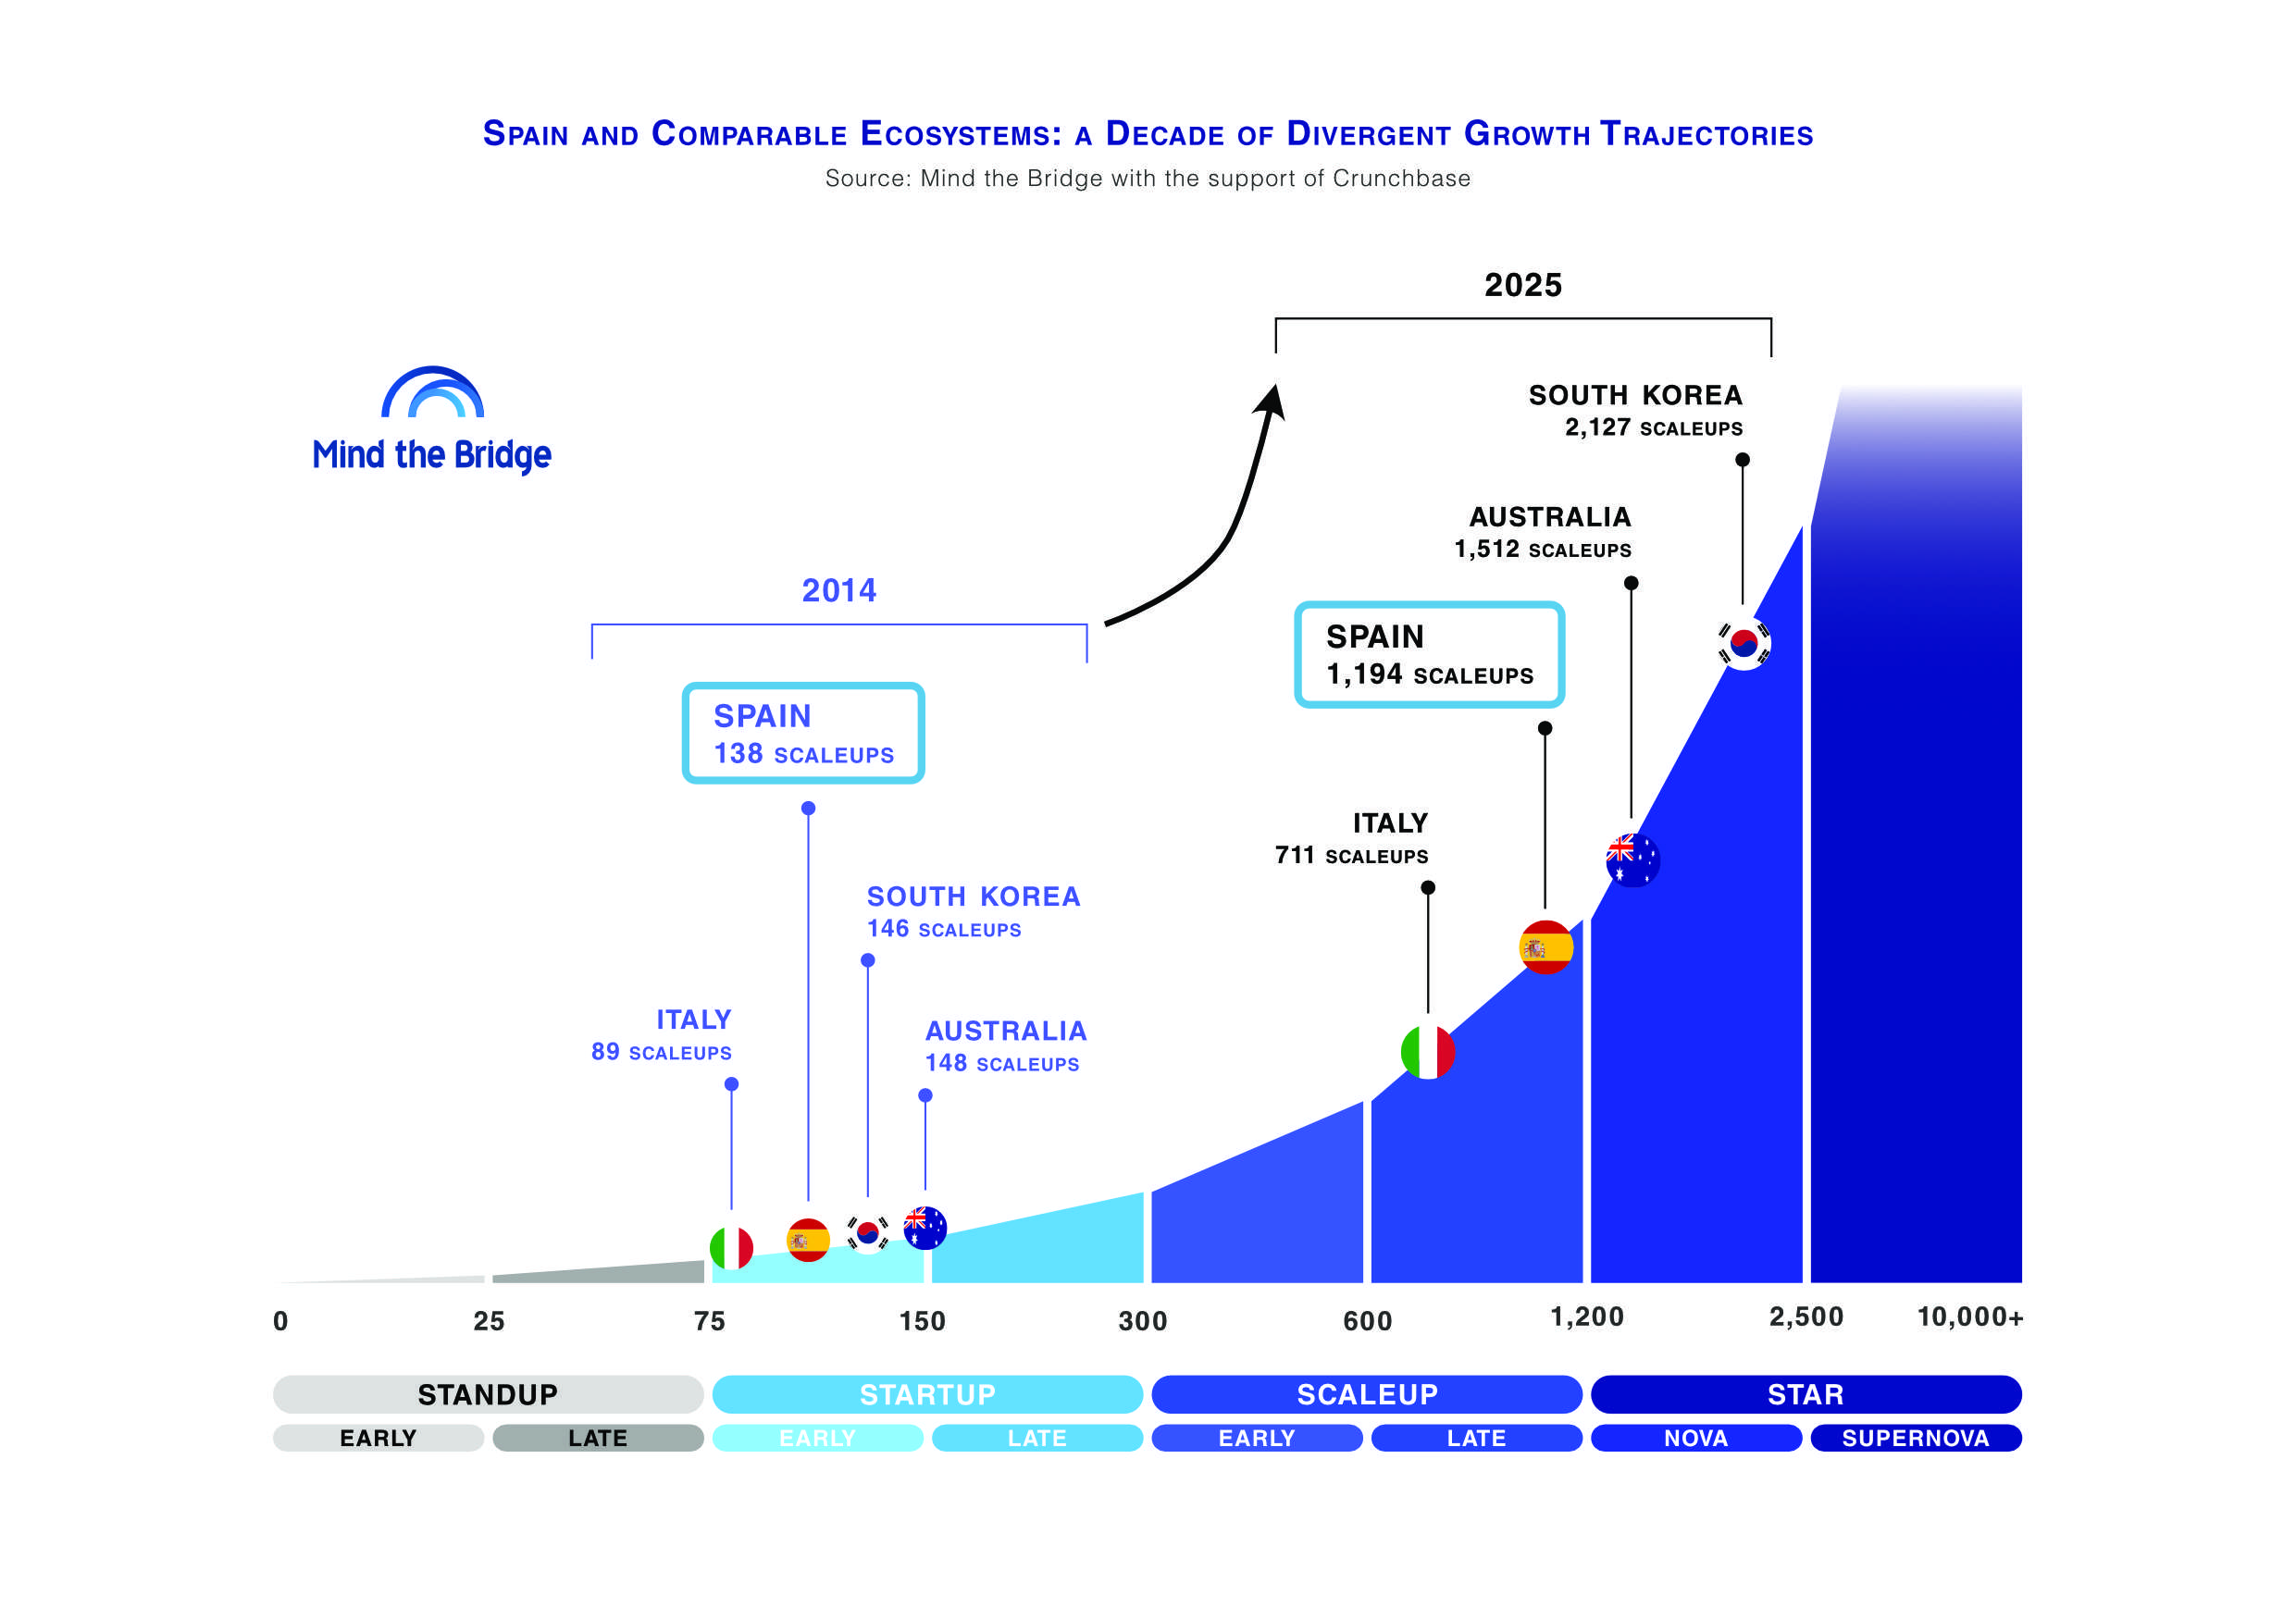 Just 10 years ago, Korea was about 40% smaller than Japan and Germany, comparable in size to Australia and Spain, and slightly ahead of Singapore and Italy. Fast-forward 10 years, and Korea had become the clear leader of the pack. With 3,233 scaleups in 2025, Korea:
- Started pulling away from Germany and Japan, building a positive gap that appears difficult to close;
- Grew to more than double the size of Spain — Korea’s most comparable European tech ecosystem in 2015; and
- Nearly doubled the size of Singapore, the other Far East tech haven.
Strategy, not luck
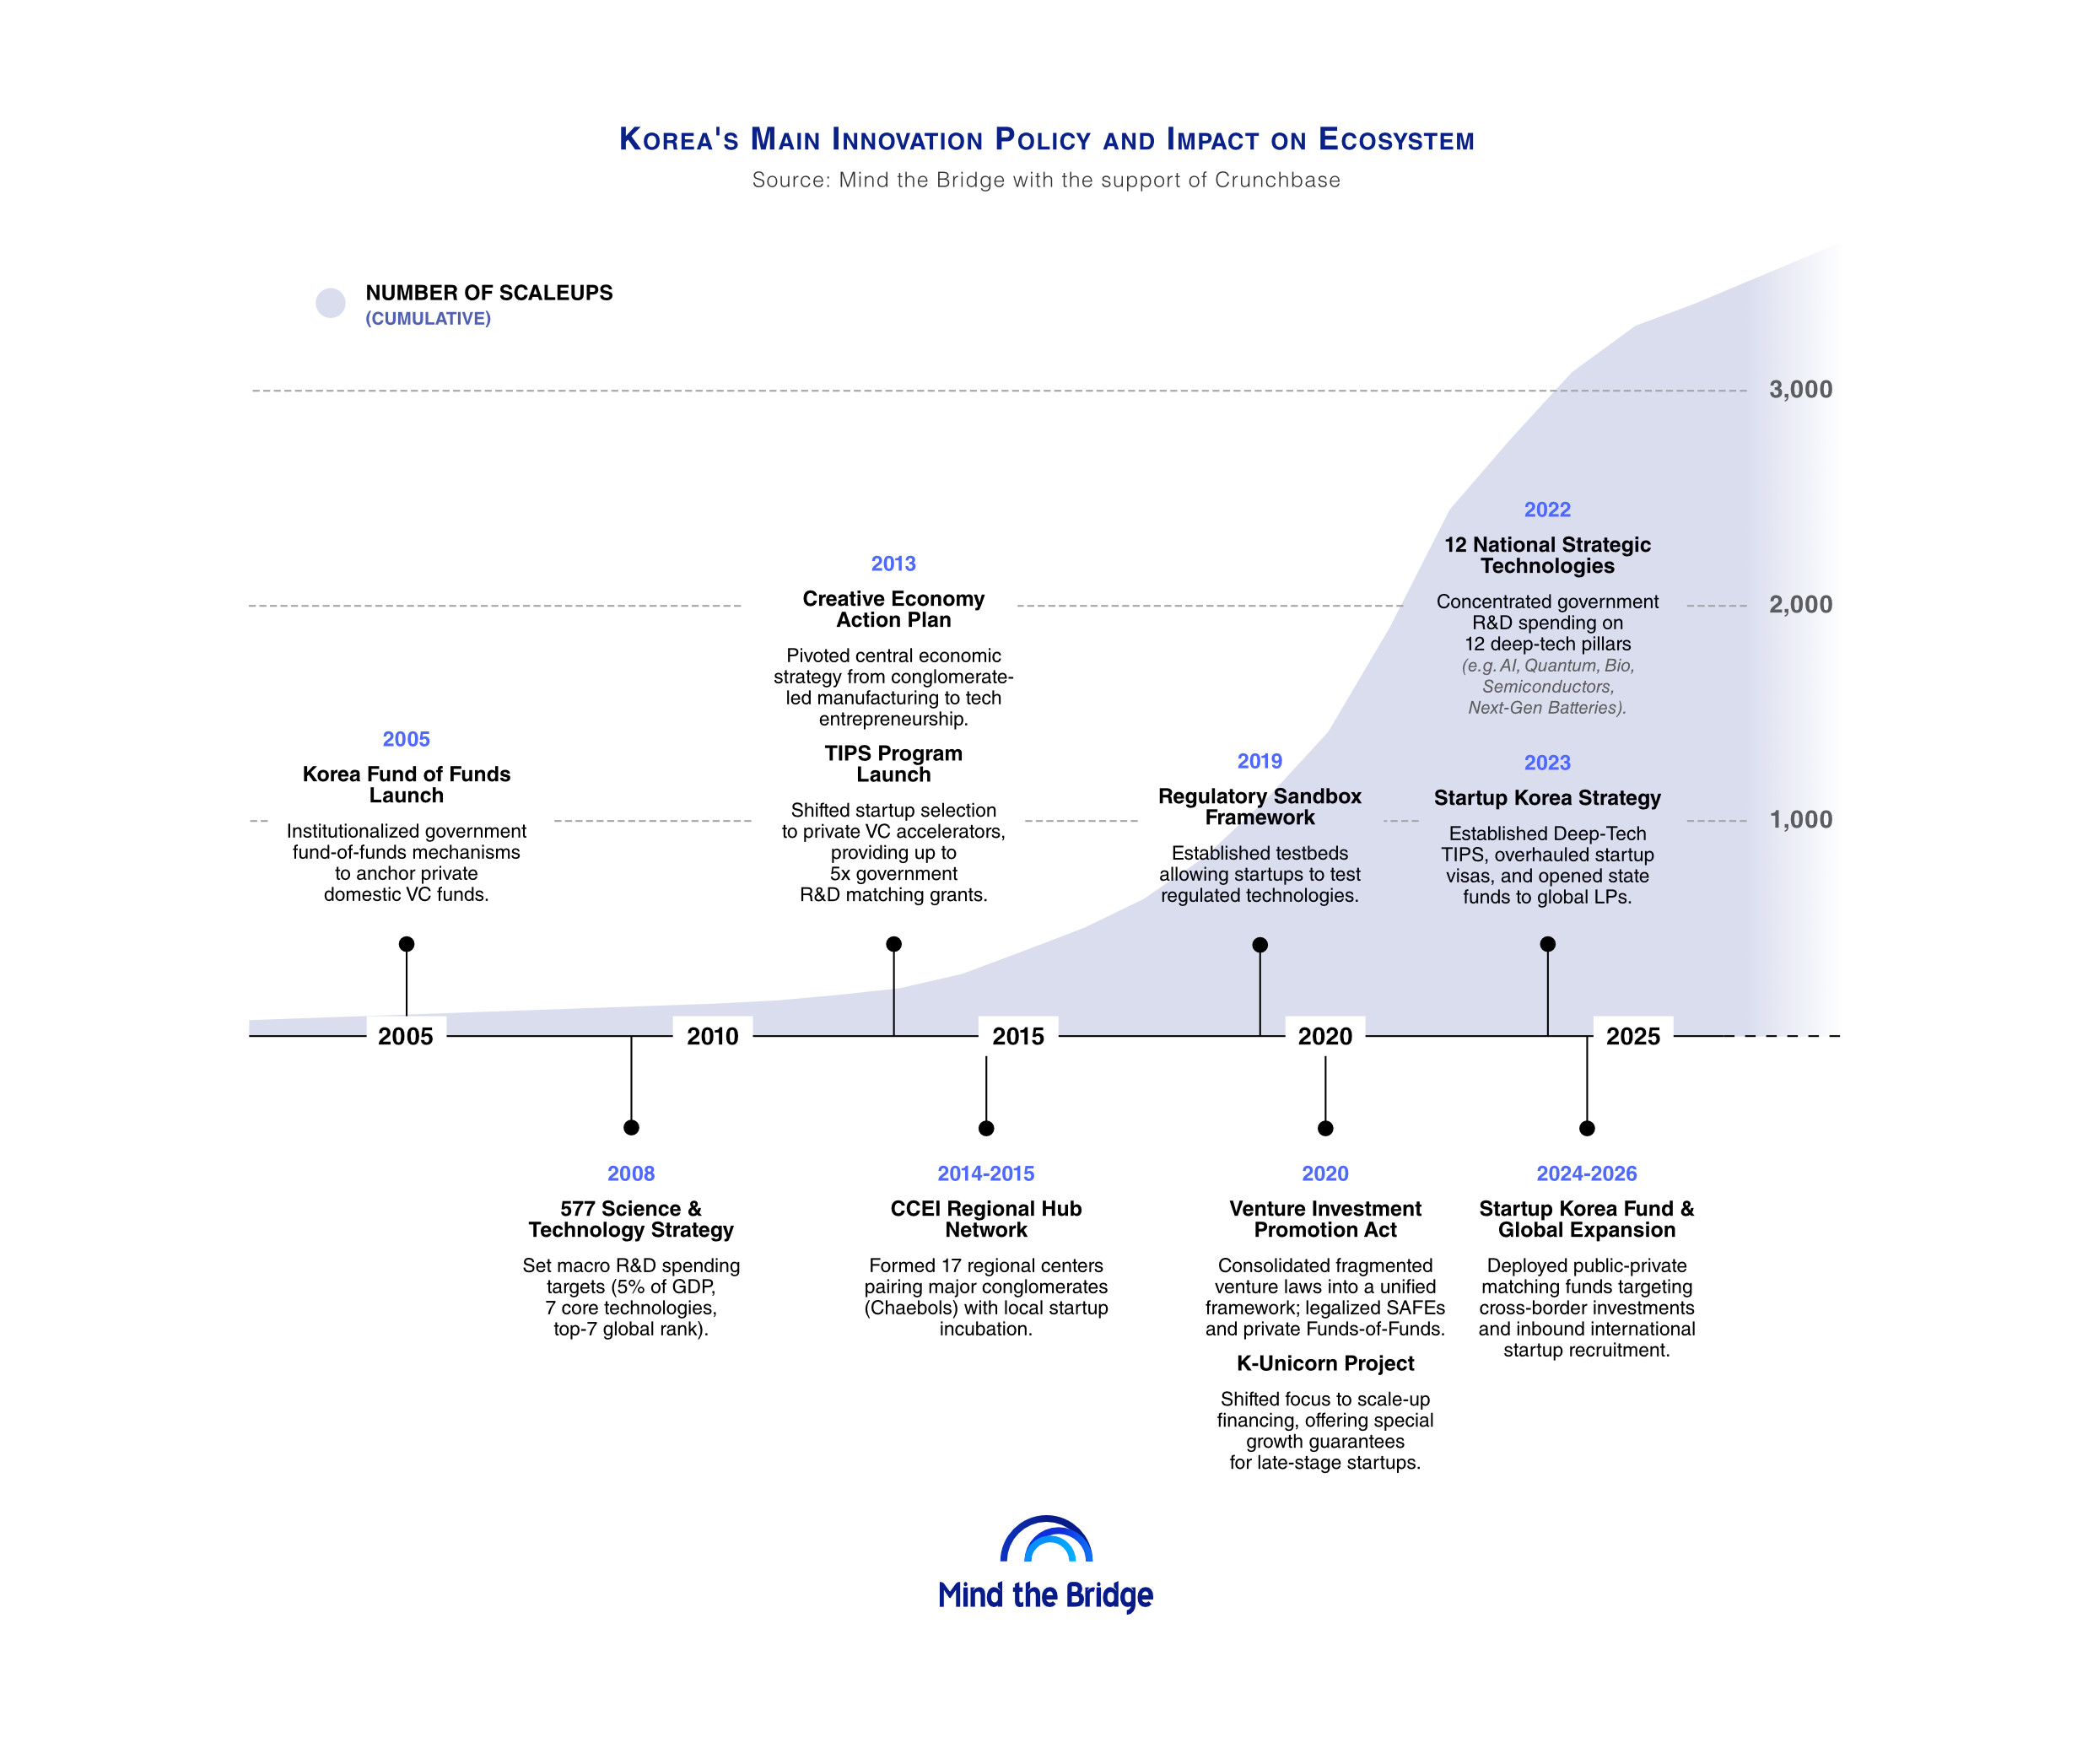
The extraordinarily rapid growth of the Korean innovation economy is not the result of chance, but rather of more than two decades of forward-looking strategic government direction.
After establishing the basic framework for a radical increase in R&D spending — from 2%-3% of GDP to a minimum of 5% in 2008 — Korea, in 2013, underscored the centrality of tech entrepreneurship as a strategic pillar of the economy, alongside the launch of TIPS, or Tech Incubator Program for Startup, to boost the early-stage segment. Subsequent policies expanded on this framework by supporting the scaling process of local tech companies. In particular, between 2014 and 2015, 17 regional centers of innovation (CCEI — Centers for Creative Economy and Innovation) were established, bringing together local large conglomerates (chaebols) and startup incubation activities.
New regulatory frameworks allowed greater freedom for experimentation by tech companies, opened the door to new forms of financing, and provided incentives for scaleup financing. More recently, starting in 2022, new dedicated strategies and instruments have contributed to a major shift, concentrating investments and tools on deep technology innovation.
The figure below highlights the impact of some flagship innovation-related policies enacted by the Korean government, juxtaposed with the historical growth of the overall scaleup ecosystem.
Get the full story in Mind The Bridge’s report, available for free download here.
Alberto Onetti is chairman of Mind the Bridge and a professor at University of Insubria. He is a serial entrepreneur who has started three startups in his career, the last of which is Funambol, among the five Italian scaleups that have raised the largest amount of capital. He is recognized among the leading international experts in open innovation and has wide experience in setting up and managing open innovation projects — venture clients, venture builders, intrapreneurship, CVCs — with large multinational companies, as well as advising and training on this subject. Onetti has a column on Sifted (Financial Times) and several other tech blogs.
Photo by Daniel Bernard on Unsplash.